Your cart is currently empty!
Driving your organisation’s performance and your career to new heights
David Parmenter’s vision is to change how leading organisations, around the world, measure, report and manage performance by 2030.
I’ve delivered workshops and keynote addresses in 32 countries. I have delivered in-house workshops, on-site or by webinar, for a range of companies. Including: The European Space Agency, Australian Post, Lloyds of London, Open University, and the Singapore Government (Peoples Association) and more.
This website will offer you methodologies to fix the common problems with performance management that will have a profound impact on your organisation and your career.

Book E-templates
All my books have a heavy focus on implementation. You can buy the electronic version of most of the book’s exhibits and the accompanying pdf toolkit.
Implementation Guides
Each guide (between 90-120 pages) includes my latest thinking and comes with E-templates.
Expert Articles
These articles (15-30 pages) cover my latest research on the topic. They also come with accompanying E-templates and are the equivalent of other writers’ whitepapers.
Book Owner’s PDF Toolkit (Free)
To limit the size of my books over 100 pages of templates have been provided via a PDF toolkit to help the reader implement change. These are referred to at the end of every chapter.
The PDF toolkit is to be read and used in conjunction with your book. You can also purchase E-templates ( Microsoft files) of the PDF Toolkit, most of the Book exhibits and some additional PowerPoint sale pitches.
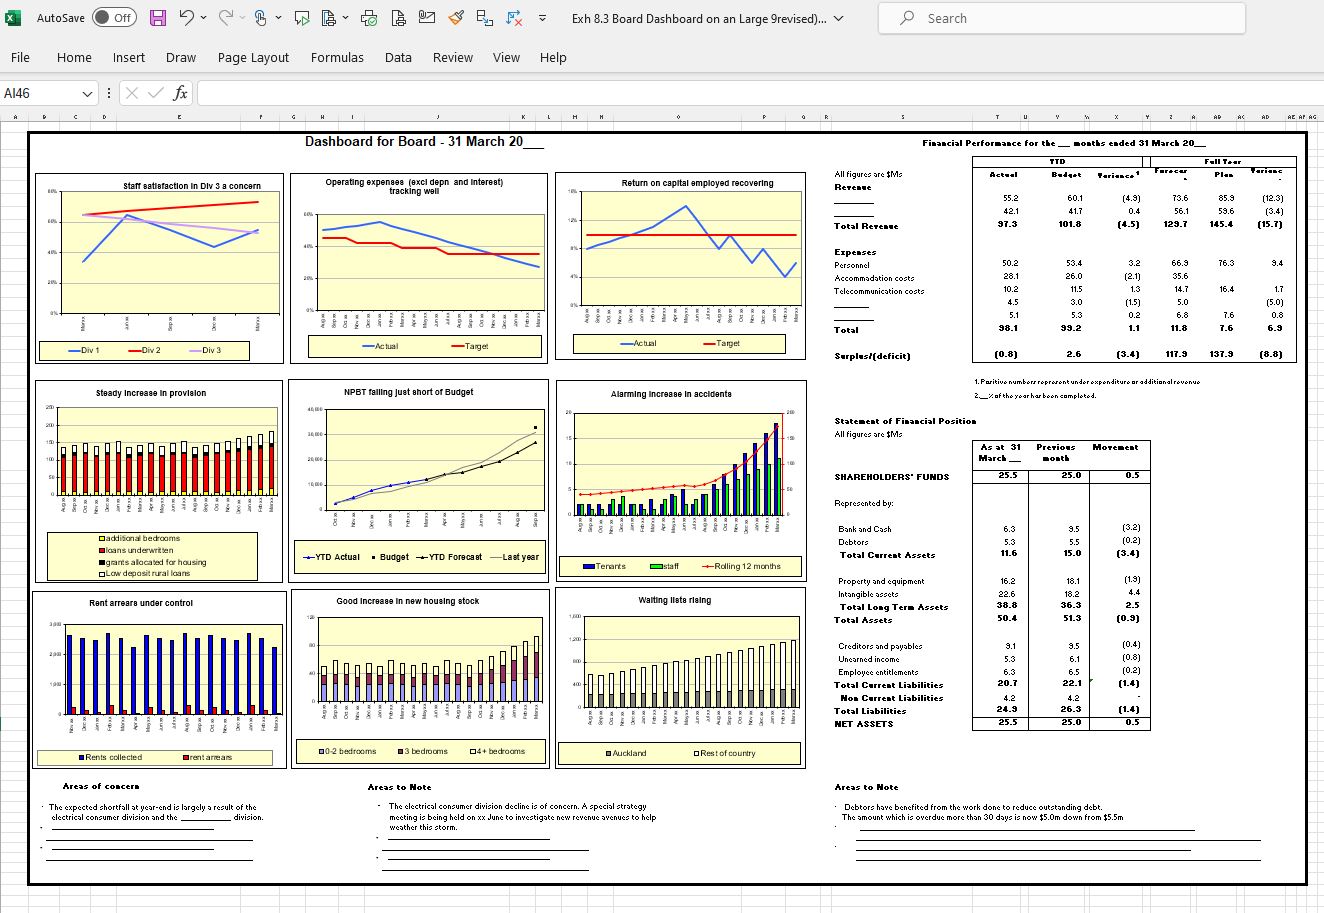
A ‘One Screen’ Board Dashboard Template
Source: E-template from David Parmenter’s implementation guide on how to write a finance report that people will read.
Because the board’s role is one of governance and not of management they need indicators of overall performance that need only be reviewed monthly or bimonthly.
These measures are called key result indicators (KRIs). Typically, a board would need to see between 9 and 12 graphs covering the critical success factors and outcome statements. These measures work particularly well in helping the board focus on strategic rather than management issues, and they will support management in their thrust to move board meetings away from the monthly cycle. These KRIs are best reported in a dashboard. A dashboard should be a one-screen display with the graphs, summary financials, and commentary in two headings (‘Areas of Concern‘ and ‘Areas to Note‘).
A ‘One Screen’ Month-end Finance Report To The CEO Template
Source: E-template from David Parmenter’s implementation guide on how to write a finance report that people will read.
I came across this clever one A3 page Month-end finance report (U.S. standard fanfold). Headings are ‘Areas to Note‘, ‘The Month’s Financial Performance’, ‘Business Unit Performance’, and a very summarized P&L and Balance Sheet. You can also use the back of the A3 for analysing the business units or showing smaller units (retail shops) in three league tables (the large, medium and small). If designed right this one-screen/A3 page will become the main report.

Testimonials
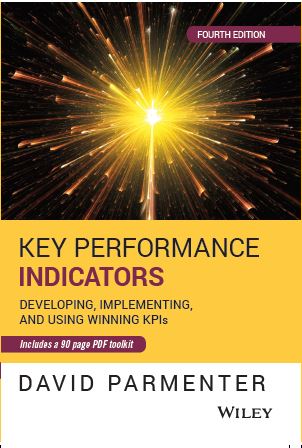
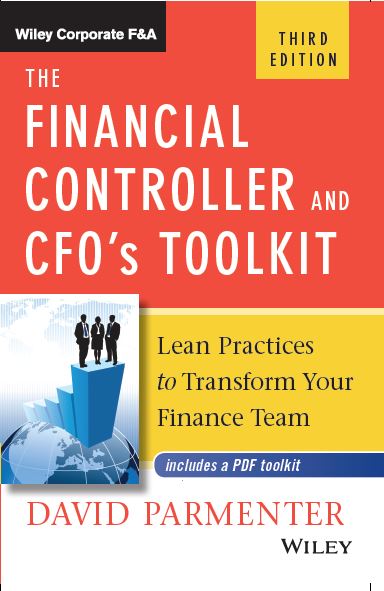
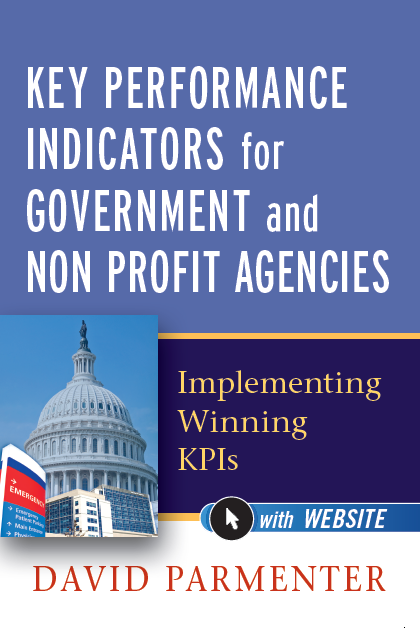
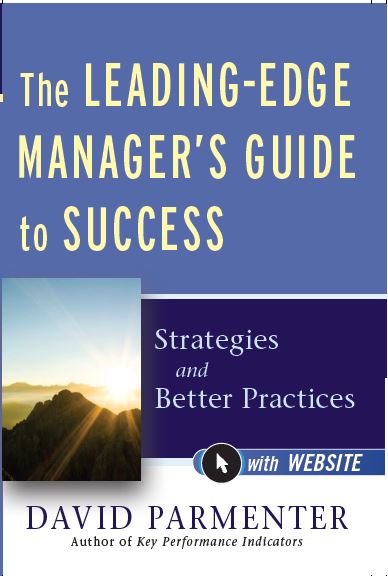
The latest editions of David’s books
Package Deals
-
Product on saleWorking Guide Package Deal (13 working guides valued at US$365 )Original price was: $365.00.$145.00Current price is: $145.00.
-
Product on saleTransforming the Finance Function – 3 Implementation Guides (Quarterly Rolling Forecasting, Fast Close and Rapid Annual Planning) & KPI databaseOriginal price was: $399.00.$299.00Current price is: $299.00.
-
Product on saleKPI Implementation Package less than 250 staff (KPI and Critical Success Factors Implementation Guides, KPI book templates + KPI database)Original price was: $299.00.$199.00Current price is: $199.00.
-
Product on saleKPI Implementation Package For Government and Non Profit Agencies (KPI and Critical Success Factors Implementation Guides, KPI book templates + KPI database)Original price was: $299.00.$199.00Current price is: $199.00.
-
Product on salePlanning package ( Rolling forecasting + fast annual budgeting Implementation Guides, and the E-templates from the Financial Controllers and CFO’s ToolkitOriginal price was: $299.00.$199.00Current price is: $199.00.
-
Product on saleKPI Implementation Package >250 staff (KPI and Critical Success Factors Implementation Guides, KPI book templates + KPI database)Original price was: $299.00.$199.00Current price is: $199.00.
Dear David,
I wanted to write and say thank you for the positive impact you have had on my own financial career and journey. I first came across your work at a CIMA workshop on KPIs in the early 2000’s. It was held in London. I think it may have been at the CIMA Institute HQ.
I was truly inspired that day not only by the content delivered but the way you delivered it. Since then, I’ve purchased your books, updated editions, etc. and have applied many principles. Without a doubt, the inspiration and the application of your ideas/concepts have given me success, and that success has allowed me life experiences that I would not have thought possible.
I always recommend your books to my peers, finance staff, and those going through graduate programs, etc and enjoy the benefits. The faster month-end close and post-it session to get there has been a particular favorite of mine. It gets the foundations right for the next stages in a Finance department’s evolution.
I’ve thought about writing something like this for many years and showing my gratitude. Today I thought I’d just be kind and get on with saying thanks. All the best.
— David Stuart Finance Director Holker Group

Frequently Asked Questions
If I buy an implementation guide, how long does it take to be sent to me?
About two working days. Once I have received the advice from PayPal, I review the guide and insert any relevant new learnings before sending the PDF + E-templates.
Can I buy David’s books from the web?
All books are available from leading online book sellers.
How long does it take to implement KPI in my company?
The goal is 16 weeks if you follow my advice for a full-time KPI team. Unfortunately, most implementations are driven by a well-meaning in-house team that still has other pressing duties, so the rollout can take up six months.
Is it possible for David Parmenter to help the organisation with the implementation?
I can train an in-house team via webinar technology. I also help sell the concept by delivering key presentations to in-house audiences. I have done this successfully for the last ten years.
How best to follow David’s latest work?
My first route is via my LinkedIn page, and then I post on my blog a bit later.
