Your cart is currently empty!
A ‘One Screen’ Board Dashboard Template
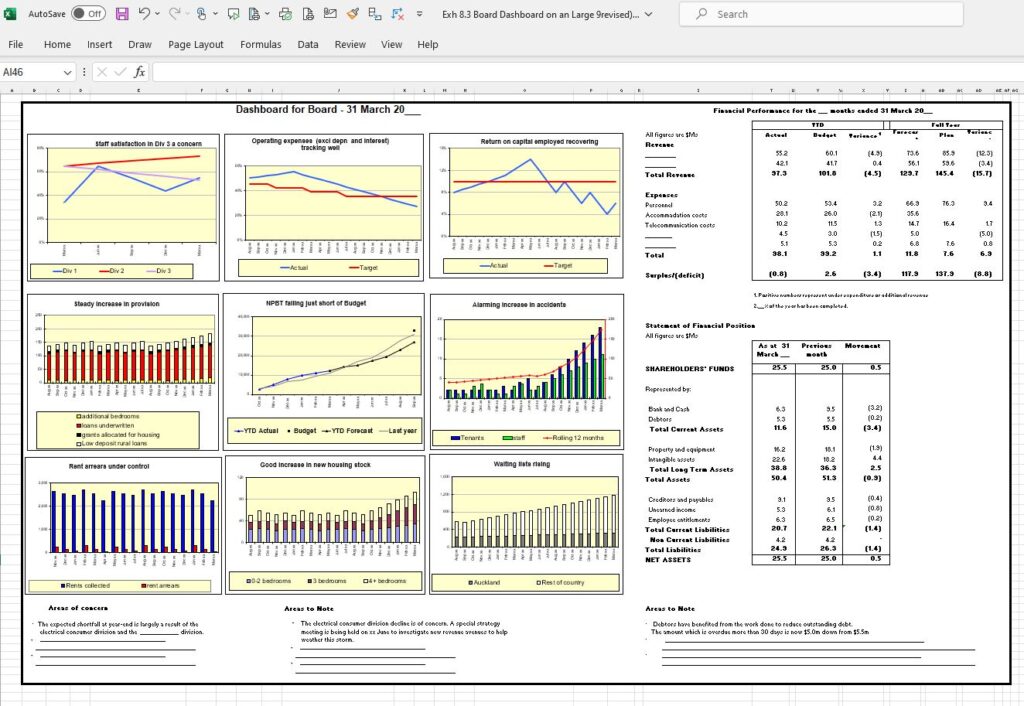
In most organisations with boards, there is a major conflict of interest over what information is appropriate for the board to receive. Because the board’s role is one of governance and not of management, it is inappropriate to provide the board with KPIs.
We need indicators of overall performance that need only be reviewed monthly or bimonthly. These measures need to tell the story about whether the organisation is being steered in the right direction at the right speed, whether the customers and staff are happy, and whether we are acting environmentally friendly.
These measures are called key result indicators (KRIs). Typically, a board would need to see between 9 and 12 graphs covering the critical success factors and outcome statements. These measures work particularly well in helping the board focus on strategic rather than management issues, and they will support management in their thrust to move board meetings away from the monthly cycle. These KRIs are best reported in a dashboard. A dashboard should be a one-screen display with the graphs, summary financials, and commentary in two headings (Areas of Concern and areas to Note).