Your cart is currently empty!
KPIs have 7 Characteristics that Make Them Unique
A Key Performance Indicator (KPI) “focuses on the aspects of organisational performance that are the most critical for the current and future success of the organisation.”
KPIs have 7 characteristics that make them unique and limit the number to no more than 10 for the whole organization:
1. All KPIs are Non-Financial (not expressed in $s, Yen, Pounds, Euro, etc)
When you put a dollar, yen, pound, or euro sign on a measure, you have already converted it into a result indicator (e.g., daily sales are a result of activities that have taken place to create the sales). The KPI lies deeper down. It may be the number of visits to contacts with the key customers who make up most of the profitable business.
3. All KPIs have the CEO’s attention
All KPIs will have the CEO’s constant attention, with daily calls being made to the relevant staff enquiring about exceptions or recognising their outstanding performance. Staff will perceive talking about poor performance with the CEO on a regular basis as career-limiting and will take innovative steps to prevent recurrences.
5. All KPIs can be tied to a team (A team will accept responsibility and can take action to improve the KPI)
A KPI is deep enough in the organization that it can be tied to a team. In other words, the CEO can call someone and ask, “Why did this happen?” and that manager will take on the responsibility to fix the issue. Return on capital employed has never been a KPI because the CEO would get nowhere saying to a GM, “Pat, I want you to increase the return on capital employed today.”
7. All KPIs have a limited dark side (the unintended negative consequence)
All measures have a dark side, an unintended consequence where staff will take some remedial actions that will be contrary to the desired intentions. Before becoming a KPI, a performance measure needs to be tested to ensure that it helps teams align their behaviour to benefit the organization and the unintended consequence associated with using the measure is not significant.
2. All KPIs are measured frequently (e.g., 24 by 7, daily, or weekly)
KPIs should be monitored 24/7, daily, or perhaps weekly for some. A monthly, quarterly, or annual measure cannot be a KPI, as it cannot be key to your business if you are monitoring it well after the horse has bolted. I have yet to see a monthly performance measure improve an organisation’s performance.
4. All KPIs are clear and concise (All staff understand the measure and what corrective action is required)
A KPI should tell you about what action needs to take place. The British Airways ‘late plane’ KPI communicated immediately to everybody that there needed to be a focus on recovering the lost time. Cleaners, caterers, ground crew, flight attendants, and liaison officers with traffic controllers would all work some magic to save a minute here and a minute there whilst maintaining or improving service standards.
6. All KPIs have a significant impact on one or more of the organization’s critical success factors
A KPI will affect more than one critical success factor and most of the balanced scorecard perspectives. In other words, when the CEO focuses on the KPI, and the staff follows the organisation scores goals in all directions.
So, the Board of Directors get a different measure, a Key Result indicator
In contrast, Key Result Indicators (KRIs) are measures that have often been mistaken for KPIs. The common characteristic of these measures is that they are the result of many actions carried out by many teams, hence the use of the term “result”. They give a clear picture of whether your organization is traveling in the right direction at the right speed. They provide the board or governing body with a good overview as to the progress with regard to the organization’s strategy. These measures are easy to ascertain and are frequently reported already to the board of government body.
15 examples of KPIs you might be interested in
KPIs are rarely new to the organisation. Either they have not been recognized or they were gathering dust somewhere unknown to the current management team.
Measuring any exception that relates to delivery in full on time to key customers including:(1-7)
- Late deliveries over two hours late to key customers—reported intraday to the CEO
- Incomplete deliveries to key customers—reported intraday to the CEO
- Late planes in the sky over two hours late—reported intraday to the CEO
- Late projects which have passed their original deadline—reported weekly to the executive team
- Complaints from our key customers that have not been resolved within __ hours—reported intraday to the executive team
- Key customer service requests outstanding for more than 48 hours—reported intraday to the executive team
- Date of next visit to major customers by customer name—reported weekly to CEO and GMs
Measures that relate to recruiting the right people all the time:(8-9)
- Key position job offers that are over 48 hours old and have not yet been accepted by the chosen candidate—reported daily to the executive team
- Names of shortlisted candidates for whom the next round of interviews has yet to be scheduled—reported daily to the executive team
Measures that relate to staff satisfaction(10-12)
- Number of planned CEO recognitions for next week/two weeks— reported weekly to the CEO
- Number of initiatives implemented after staff satisfaction survey— reported weekly to the executive team for up to two months after a survey
- Staff in vital positions who have handed in their notice in the last hour—reported within one hour to the CEO.
Measures that relate to training(13)
- Number of vacant places at an important in-house course— reported daily to the CEO in the last three weeks before the course is due to run
Measures that relate to innovation(14-15)
- Number of innovations planned for implementation in the next 30, 60, or 90 days—reported weekly to the CEO
- Number of abandonments to be actioned in the next 30, 60, or 90 days—reported weekly to the CEO
KPI reporting templates
- KPI reporting templates(same with next one link)
- 15 steps to a KPI project
- How to generate KPIs for your organisation in 3 stage process.
- 15 smart KPIs that that you can use
- 3 ways KPIs can transform your business
- 4 reasons why you might wish to abandon your broken KPIs
- 5 KPIs to avoid
- Answers to the most common KPI questions
- How to choose the right KPIs for your business
- Ten guidelines for designing KPI graphs
- Ten KPI implementation lessons
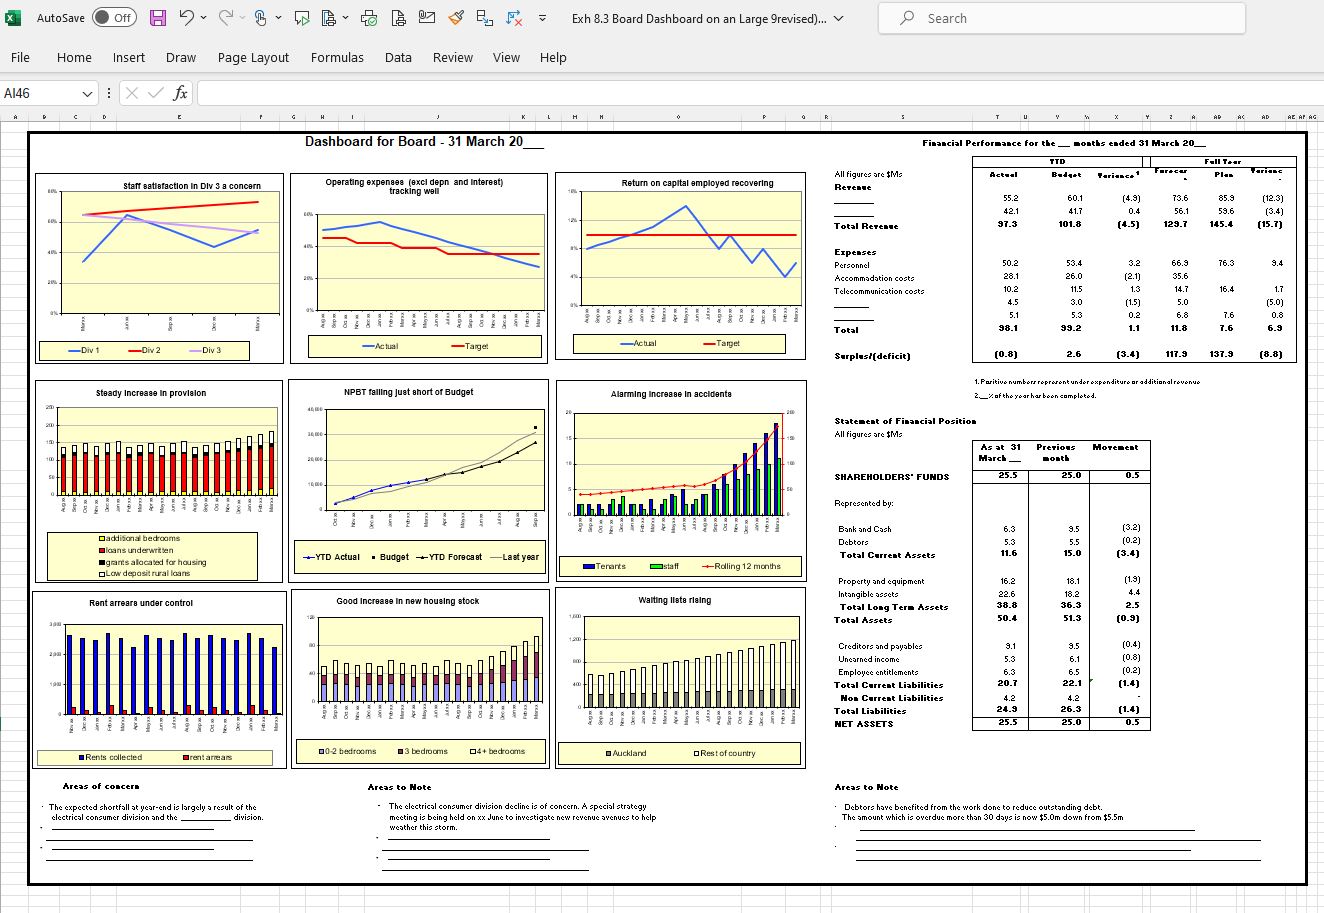
Board One Screen Dashboard Template
Source: E-template from implementation guide.
Because the board’s role is one of governance and not of management they need indicators of overall performance that need only be reviewed monthly or bimonthly.
These measures are called key result indicators (KRIs). Typically, a board would need to see between 9 and 12 graphs covering the critical success factors and outcome statements. These measures work particularly well in helping the board focus on strategic rather than management issues, and they will support management in their thrust to move board meetings away from the monthly cycle. These KRIs are best reported in a dashboard. A dashboard should be a one-screen display with the graphs, summary financials, and commentary in two headings (‘Areas of Concern‘ and ‘Areas to Note‘).
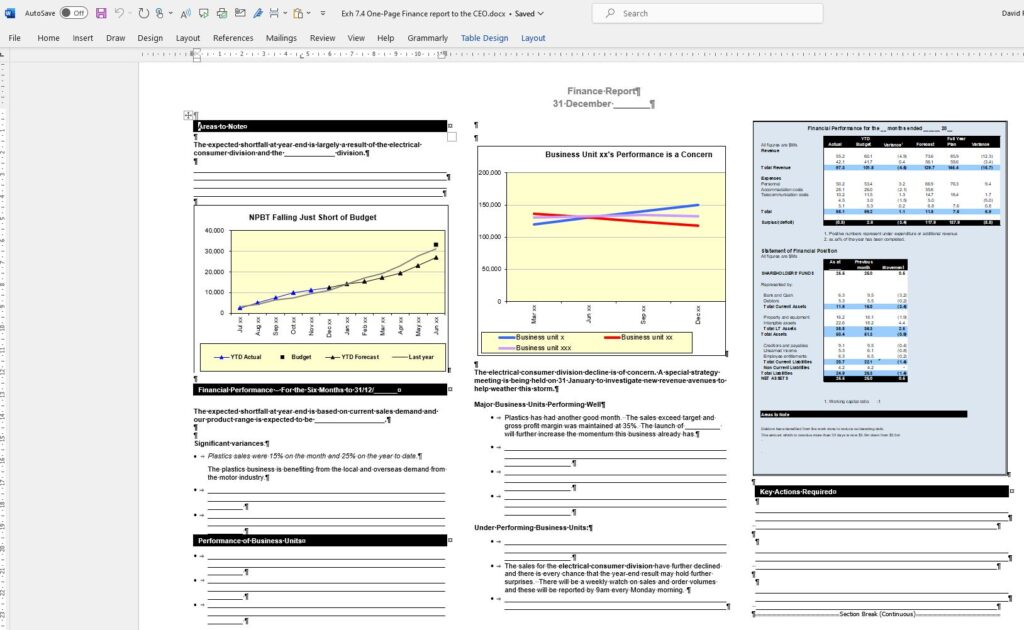
One Screen Monthly Finance Report To CEO Template
Source: E-template from implementation guide.
All CEOs like a great summary. In my research, I came across this clever one A3 page report(U.S. standard fanfold). Headings are ‘Areas to Note‘, ‘The Month’s Financial Performance’, ‘Business Unit Performance’, and a very summarized P&L and balance sheet. You can also use the back of the A3 for analysing the business units. For a retail operation I suggested they put their 200 retail shops in three league tables, the large, medium and small shops based on sales per square foot or employee, shading the top and bottom quartiles. If designed right this one-screen/A3 page will become the main report.

Next steps(could removed)
- Read my KPI articles on my KPI webpage
- To understand more about the difference of the two types of measures, you can access, free of charge, chapter one, “The Great KPI Misunderstanding”.
- To understand how to report performance measures read my Chapter 10 Reporting Performance measures from Key Performance Indicators 4th edition.
- Purchase :
- my KPI Toolimplementation guide relevant to your size of organisation (under 100, 100-250, and over 250 FTEs) (currently on sale at over 40% discount)
- my Finding your Organization’s Critical Success Factors – implementation guide (Whitepaper 115 pages+ electronic templates)
- my updated: Database of Measures and Associated Success Factors 4th Edition
- Deliver a compelling ‘Killer’ presentation using the presentation kit included in the Etemplates that are included in the KPI implementation guide. (to be removed with careful thoughts)

